Below are my attempts to work through the solutions for the exercises of Chapter 3 of Richard McElreath’s ‘Statistical Rethinking: A Bayesian course with examples in R and Stan’. If anyone notices any errors (of which there will inevitably be some), I would be happy to be notified!
You can find out more about the book (including a link to full-length lectures!) here.
I won’t post the full details of all questions. Highlighted syntax refers to R code.
The first problems use the samples from the posterior distribution of a globe tossing example (possible values: water or land). This code (from the book + my annotations) provides the specific set of samples.
# This forms the grid for the grid approximation procedure (approximation of the continuous posterior distribution) that we're using in these earlier chapters. This defines a grid of 1000 points.
p_grid <- seq(from=0, to=1 , length.out=1000)

# This determines the value of the prior at each parameter value on the grid. This case sets a constant prior across all parameter values.
prior <- rep(1, 1000)

# Likelihood at each parameter value for 6 observations of water from 9 tosses.
likelihood <- dbinom(6, size=9, prob=p_grid)

# The unstandardised posterior at each parameter value.
posterior <- likelihood * prior

# The standardised posterior (each value divided by the sum of all values).
posterior <- posterior / sum(posterior)

# "setting the seed" apparently ensures that the following sample() function produces identical (rather than random) results each time.
set.seed(100)
samples <- sample(p_grid, prob=posterior, size=1e4, replace=TRUE)
3E1
How much posterior probability lies below p = 0.2?
sum(posterior[p_grid < 0.2])
mean(samples < 0.2)
[1] 0.0008560951
[1] 5e-04
5e-04 = 0.0005
So values below 0.2 (the globe being covered by <20% water) are quite unlikely.
3E2
How much posterior probability lies above p = 0.8?
sum(posterior[p_grid > 0.8])
mean(samples > 0.8)
[1] 0.1203449
[1] 0.1117
3E3
How much posterior probability lies between p = 0.2 and p = 0.8?
sum(posterior[p_grid > 0.2 & p_grid < 0.8])
mean(samples > 0.2 & samples < 0.8)
[1] 0.878799
[1] 0.8878
Corrections to 3E1-3E3 (03.01.19): Jeffrey Girard pointed out that the question specifically says to “use the values in samples” rather than the “posterior” to answer these questions. Thanks, Jeff!
3E4
20% of the posterior probability lies below which value of p?
quantile(samples, 0.2) 20%
0.5195195
3E5
20% of the posterior probability lies above which value of p?
quantile(samples, 0.8) 80%
0.7567568
3E6
Which values of p contain the narrowest interval equal to 66% of the posterior probability?
library(rethinking)

# My understanding of narrowest = the peak of the curve/distribution = highest posterior density interval (HPDI)

HPDI(samples, prob=0.66)
|0.66 0.66|
0.5205205 0.7847848
So about a quarter of the values representing proportion of water (p) provides the central 66% of the probability mass.
3E7
Which values of p contain 66% of the posterior probability, assuming equal posterior probability both below and above the interval?
#  Equal posterior probability requires the regular percentile interval (equal mass on both tails)

PI(samples, prob=0.66)
17% 83%
0.5005005 0.7687688
As the answers in 3E6 and 3E7 are fairly similar, we can conclude that the posterior distribution isn’t too highly skewed in either direction.
3M1
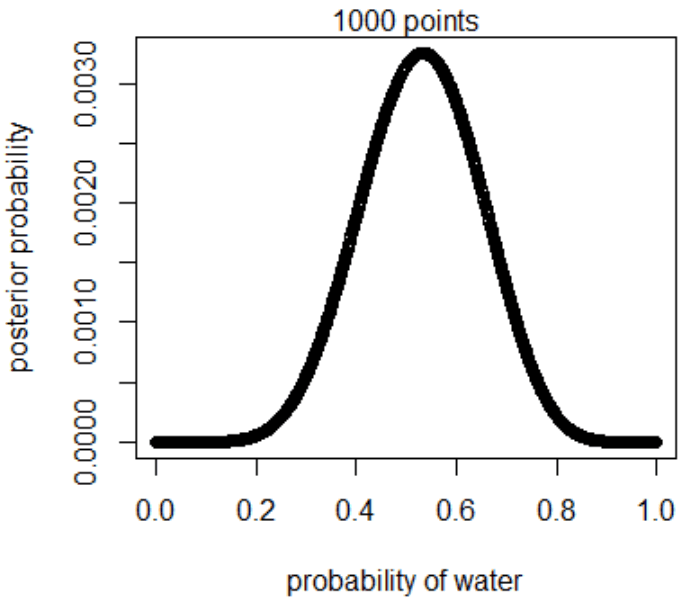
Suppose the globe tossing data had turned out to be 8 water in 15 tosses. Construct the posterior distribution, using grid approximation. Use the same flat prior as before.
5 steps of grid approximation (these are the same steps that generated the initial sample above):
- Define the grid (number of points to estimate the posterior)
- Compute prior at each parameter value
- Compute likelihood at each parameter value
- Compute unstandardised posterior at each parameter value (prior × likelihood)
- Standardise the posterior (each value divided by the sum of all values)
p_grid <- seq(from=0, to=1 , length.out=1000)
prior <- rep(1, 1000)
likelihood <- dbinom(8, size=15, prob=p_grid)   #the only difference to the original code
posterior <- likelihood * prior
posterior <- posterior / sum(posterior)
plot(p_grid, posterior, type="b",
     xlab="probability of water", ylab="posterior probability")
mtext("1000 points")
3M2
Draw 10,000 samples from the grid approximation from above. Then use the samples to calculate the 90% HPDI for p.
samples <- sample(p_grid, prob=posterior, size=1e4, replace=TRUE)
HPDI(samples, prob=0.9)
|0.9 0.9|
0.3243243 0.7157157
This is the narrowest interval containing 90% of the probability mass
3M3
Construct a posterior predictive check for this model and data. This means simulate the distribution of samples, averaging over the posterior uncertainty in p. What is the probability of observing 8 water in 15 tosses?
# For each sampled value, a random binomial observation is generated. Since the sampled values appear in proportion to their posterior probabilities, the resulting simulated observations are averaged over the posterior.

ppc <- rbinom(1e4, size=15, prob=samples)

# The probability of observing 8 water in 15 tosses can be summarised as the point estimate. The highest posterior probability, a maximum a posteriori (MAP) estimate.

table(ppc)/1e4
ppc
0 1 2 3 4 5 6 7 8 9 10 11 12
0.0005 0.0037 0.0106 0.0285 0.0539 0.0834 0.1139 0.1412 0.1446 0.1387 0.1095 0.0821 0.0521
13 14 15
0.0281 0.0076 0.0016
The probability of observing 8 water in 15 tosses is 0.1446, which appears to be the biggest probability of all possible values in this sample.
3M4
Using the posterior distribution constructed from the new (8/15) data, now calculate the probability of observing 6 water in 9 tosses.
ppc2 <- rbinom(1e4, size=9, prob=samples)
table(ppc2)/1e4
ppc2
0 1 2 3 4 5 6 7 8 9
0.0047 0.0283 0.0765 0.1441 0.1856 0.2024 0.1769 0.1143 0.0540 0.0132
Observing 6 water in 9 tosses has a probability of 0.1769, which isn’t the most likely value based on this data set.
3M5
Start over at 3M1, but now use a prior that is zero below p = 0.5 and a constant above p = 0.5. This corresponds to prior information that a majority of the Earth’s surface is water. Repeat each problem above and compare the inferences. What difference does the better prior make? If it helps, compare inferences (using both priors) to the true value p = 0.7.
p_grid <- seq(from=0, to=1 , length.out=1000)
prior <- ifelse(p_grid < 0.5, 0, 1)      # zero below p = 0.5 and constant above
likelihood <- dbinom(8, size=15, prob=p_grid)
posterior <- likelihood * prior
posterior <- posterior / sum(posterior)

samples <- sample(p_grid, prob=posterior, size=1e4, replace=TRUE)
HPDI(samples, prob=0.9)
|0.9 0.9|
0.5005005 0.7137137
The range has been narrowed down.
ppc <- rbinom(1e4, size=15, prob=samples)
table(ppc)/1e4
ppc
1 2 3 4 5 6 7 8 9 10 11 12 13
0.0001 0.0007 0.0035 0.0116 0.0355 0.0615 0.1138 0.1571 0.1779 0.1675 0.1291 0.0854 0.0380
14 15
0.0150 0.0033
8 is slightly more likely than before, yet no longer the most likely number. The prior affects the interpretation of the data. Although 70% of 15 is 10.5, so the new prior isn’t quiiite there yet.
ppc2 <- rbinom(1e4, size=9, prob=samples)
table(ppc2)/1e4
ppc2
0 1 2 3 4 5 6 7 8 9
0.0007 0.0050 0.0258 0.0780 0.1582 0.2268 0.2403 0.1650 0.0829 0.0173
6 is now the most probable observation in 9 tosses. (70% of 9 is 6.3, so that’s fairly close.)
For fun, let’s try a slightly more exact prior:
p_grid <- seq(from=0, to=1 , length.out=1000)
prior <- ifelse(p_grid < 0.6, 0, 0.7)
likelihood <- dbinom(8, size=15, prob=p_grid)
posterior <- likelihood * prior
posterior <- posterior / sum(posterior)

samples <- sample(p_grid, prob=posterior, size=1e4, replace=TRUE)
HPDI(samples, prob=0.9)
|0.9 0.9|
0.6006006 0.7467467
ppc <- rbinom(1e4, size=15, prob=samples)
table(ppc)/1e4
ppc
2 3 4 5 6 7 8 9 10 11 12 13 14
0.0001 0.0006 0.0031 0.0092 0.0268 0.0629 0.1139 0.1659 0.2006 0.1858 0.1265 0.0701 0.0285
15
0.0060
Bingo!
ppc2 <- rbinom(1e4, size=9, prob=samples)
table(ppc2)/1e4
ppc2
0 1 2 3 4 5 6 7 8 9
0.0002 0.0018 0.0092 0.0389 0.1031 0.2022 0.2463 0.2407 0.1236 0.0340
That’s more like it!
Okay, the next problems require a different data set, which basically specifies the sex of child 1 and child 2 from 100 two-child families.
library(rethinking)
data(homeworkch3)
3H1
Using grid approximation, compute the posterior distribution for the probability of a birth being a boy. Assume a uniform prior probability. Which parameter value maximizes the posterior probability?
birthboys <- sum(birth1, birth2)
p_grid <- seq(from=0, to=1, length.out=1000)
prior <- rep( 1, 200)
likelihood <- dbinom(birthboys, size=200, prob=p_grid)
unstd.posterior <- likelihood * prior
posterior <- unstd.posterior / sum(unstd.posterior)

plot(p_grid, posterior, type="b",
     xlab="probability of boy birth", ylab="posterior probability")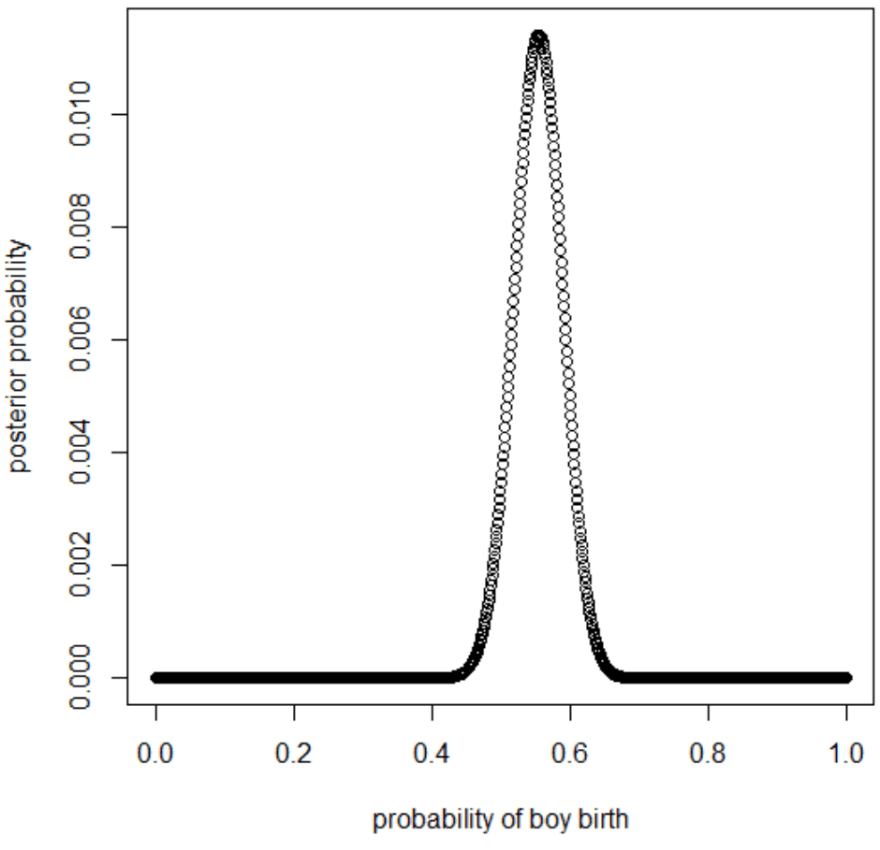
p_grid[which.max(posterior)][1] 0.5545546
3H2
Using the sample function, draw 10,000 random parameter values from the posterior distribution you calculated above. Use these samples to estimate the 50%, 89%, and 97% highest posterior density intervals.
samples <- sample(p_grid, size=1e4, replace=TRUE, prob=posterior)

# HPDI = narrowest interval containing the specified probability mass.

HPDI(samples, prob=0.50)
|0.5 0.5|
0.5313531 0.5771577
HPDI(samples, prob=0.89) |0.89 0.89|
0.4981498 0.6079608
HPDI(samples, prob=0.97) |0.97 0.97|
0.4830483 0.6315632
3H3
Use rbinom to simulate 10,000 replicates of 200 births. You should end up with 10,000 numbers, each one a count of boys out of 200 births. Compare the distribution of predicted numbers of boys to the actual count in the data (111 boys out of 200 births). There are many good ways to visualize the simulations, but the dens command (part of the rethinking package) is probably the easiest way in this case. Does it look like the model fits the data well? That is, does the distribution of predictions include the actual observation as a central, likely outcome?
simulation <- rbinom(1e4, size=200, prob=samples)
dens(simulation)
abline(v=111)
The distribution of predictions does seem to include the actual observation as a central outcome.
3H4
Now compare 10,000 counts of boys from 100 simulated first borns only to the number of boys in the first births, birth1. How does the model look in this light?
birth1sum <- sum(birth1)
likelihood2 <- dbinom(birth1sum, size=100, prob=p_grid)
prior2 <- rep( 1, 100)
unstd.posterior2 <- likelihood2 * prior2
posterior2 <- unstd.posterior2 / sum(unstd.posterior2)
samples2 <- sample(p_grid, size=1e4, replace=TRUE, prob=posterior2)

simulation2 <- rbinom(1e4, size=100, prob=samples2)
dens(simulation2)
abline(v=51)
If this was the intended interpretation, the distribution of predictions seems to include the actual observation as a central outcome here, too.
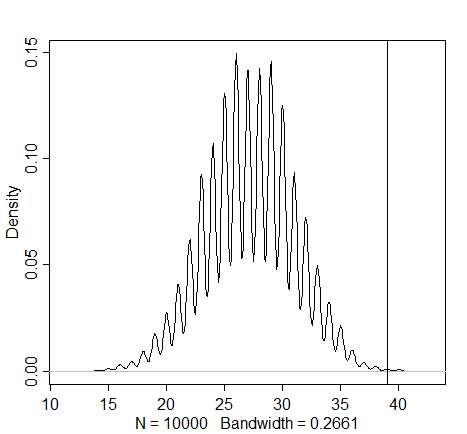
However, the question could also be interpreted differently. Here is a simulation based on the randomly pulled samples from the vector of the posterior density of the initial estimate of the whole sample:
simulation3 <- rbinom(1e4, size=100, prob=samples)
dens(simulation3)
abline(v=51)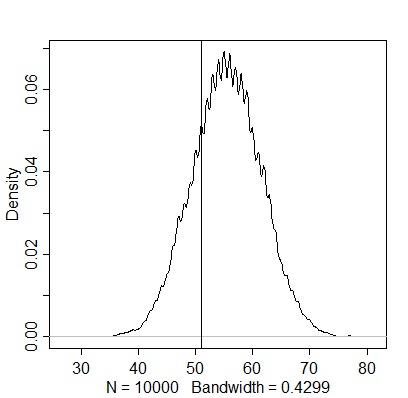
The actual number of boys appears to be below this estimation, indicating that the posterior density based on the whole sample doesn’t generalise to just first-borns. The next question mentions independence of first and second births as an assumption, although this finding already seems to contradict it.
3H5
The model assumes that sex of first and second births are independent. To check this assumption, focus now on second births that followed female first borns. Compare 10,000 simulated counts of boys to only those second births that followed girls.
firstgirls <- 100 - sum(birth1)     # number of female first-borns: 49
boysaftgirls <- birth2[birth1==0]   # this gathers the corresponding second-borns who followed a female first-born
simulation4 <- rbinom(1e4, size=firstgirls, prob=samples)
dens(simulation4)
abline(v=sum(boysaftgirls))  # the "sum" function here gives meaning to the "boys after girls" name
Here we see further evidence for the contradiction of the assumption of independence (as observed in the previous graph). The actual number of male births that follow the female births seems much higher than one would expect when assuming that first and second births are independent. As the first births seem to be divided relatively equally, these parents appear to have dabbled in sex selection.
